From the Gym to a Jupyter Notebook — Building a Squats Counter App in a Day
There’s something particularly satisfying in working with data that captures something physical in the real world. As a machine learning consultant, I’ve gotten used to working with medical data, images, etc. But when the data you see on screen captures movement, location, etc, there’s something refreshingly tangible about it all. So I got pretty excited when Andrei, founder of Moonsense, challenged me to build an app in 1 day that takes my phone’s accelerometer data and does something cool with it.
So I set about building a squat counting app in one dev day.
Getting the Data
Before we overthink how to actually quantify squat count and quality, it’s a good idea to look at some live data first. Moonsense makes it easy to get data from my iphone up to their cloud storage solution and down to my laptop. This process was pretty painless: you just download a recorder app and hit the record button to sync all the phone’s acceleration, gyro, and geographic info to their cloud, which you can later pull down to your laptop.
So I went ahead and held my phone in my hand started to pump some iron. Here’s me actually doing it with my phone in my pocket.

Every time I did a sequence of squat repetitions, I’d hit the record button and type in a free text label like “4 squats”.

That’s it. Now let’s see how we use our Moonsense API key to retrieve the data.
So, printing the acceleration data frame gives us an output like this
timestamp         x         y          z
0    1620847740629 -0.471039  5.075854   9.129929
1    1620847804060  3.401349  4.373932  10.150064
..             ...       ...       ...        ...
That makes sense. We’re seeing the acceleration our phone feels in 3 directions, with the direction x y and z surely relating somehow to the phone’s orientation.
Analyzing Our First Recordings
Let’s plot the data out and see if it makes it easier to understand.
Let’s look at the graphs this generates. Let’s first see a session where I just left the device stationary on my desk:
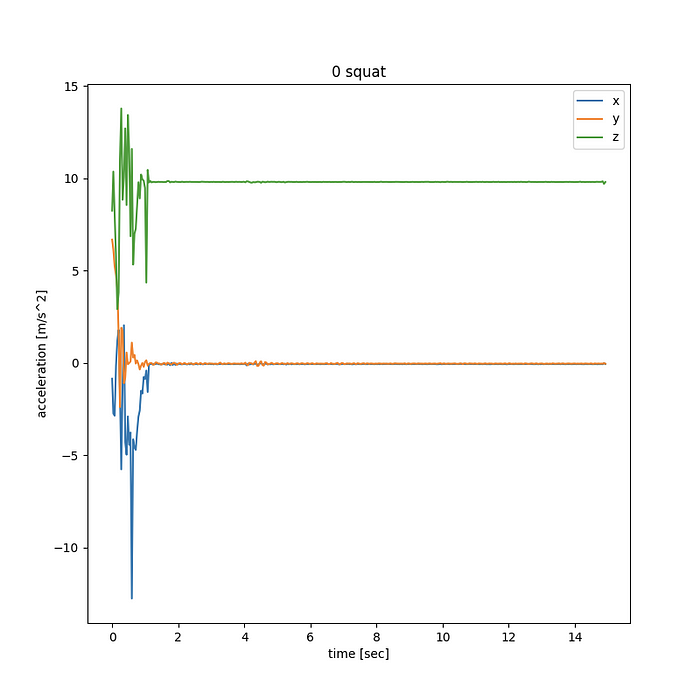
Huh! If you haven’t dealt with accelerometer data before, you might expect the data to be pretty much zero, but instead we see a large value on the z axis. The value is close to 9.81 m/sec² — earth’s gravity. So we now understand that the device will spit out all 0 only when free falling. If something’s holding it up against gravity, it will report it as an upward force (we’ll keep calling all forces acting on the device “accelerations” even though that’s a definitely a misnomer).
If the phone was held at some arbitrary angle (e.g. attached to my arm), this gravitational force wouldn’t be neatly aligned along the z axis, but split up between the various x,y,z axis. Even worse, if the phone rotates during the motion, this gravity measurement would leak between the x,y,z directions in different ways — complicating our view of the data.
Alright, so now let’s look at an actual squat session, and keep things simple for now. Let’s hold the phone in parallel to the ground in both hands, and pump out 4 squats.
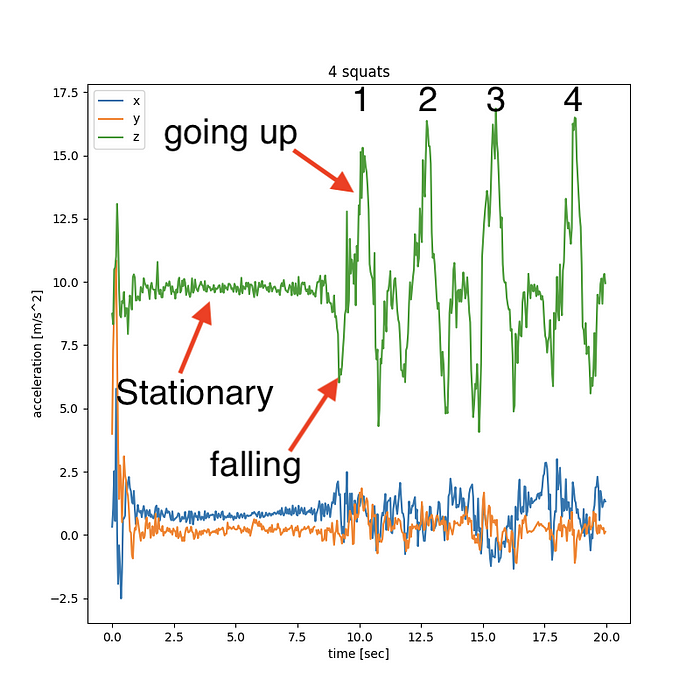
When we look at the recording with squats, we see:
- Each squat seems to comprise of two hills. A small one not far from the gravity value of 9.81 m/sec², and a very tall one, where the phone feels a very strong upward push.
- Between the two hills we see acceleration dip on the z axis, down to a minimal value of around 5–6 m/sec²
So here’s the story that explains what we’re seeing:
- Before we start squatting, and nothing’s happening, the phone feels exactly the force of us keeping it from falling — 9.81 m/sec².
- Because the phone isn’t exactly parallel to the ground, this force is broken along more than one axis — some of the 9.81 goes towards the z axis, some of it to y, etc. If my hands were True Level, we’d ideally see exactly 9.81 in the Z direction and nothing in any other direction.
- When we’re squatting down, the device is almost free falling — so the force it feels diminishes from 9.81. The difference between the observed value and 9.81 is roughly our downward acceleration.
- Finally when we get to the bottom of our squat, we’re applying a lot of upwards force — enough to both overcome gravity and change the phone’s direction of motion quite abruptly. That’s a lot! So indeed we see the phone’s reported measurement shoot way up.
Alright, So what are our takeaways from this analysis?
- Even though the phone’s overall movement is pretty much in a single up and down motion dimension, its non-fixed orientation makes our life a bit harder in that we need to figure out what’s the overall direction of “down”.
- While the overall motion we see is quite complex, simply counting the amount of large peaks does seem to equate with the number of squats we’ve recorded.
Counting Peaks
In the graph above I manually overlaid a large 1,2,3,4 digits to count the squat repetitions. Our goal right now is to replicate whatever logic that led me do this counting in code. So let’s try to break it down. What are we looking for?
- A peak of acceleration that’s significantly higher than gravity (so maybe 12+ m/sec² is a good threshold).
- Of course once we hit the peak acceleration, we’ll get lots of repeat measurements above 12, so we’ll want to to cluster them into continuous segments. Consecutive measurements in time that are above 12 obviously belong to the same squat rep, and shouldn’t be double-counted.
- To keep things simple, let’s only look at the Z axis and assume that’s the entire direction of motion. Those of you who’ve heard of Principle Component Analysis might already know we have a way to later figure out what’s the actual direction of motion, in case the phone’s orientation is at some other fixed orientation. But anyway, that’s for a later post.
So this is a kind of a naive approach, but let’s see where it gets us, and improve on it once we see how it fails.
Let’s take a look at the graph this generates:
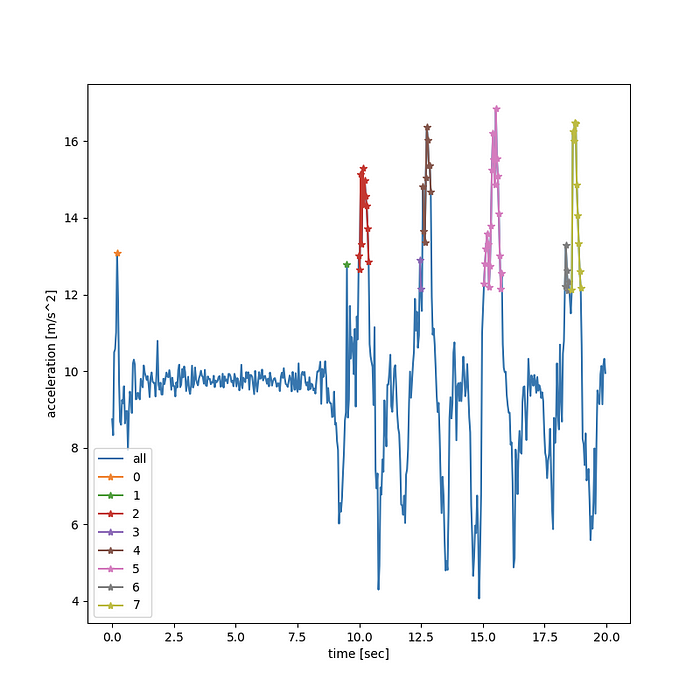
Alright! We’re really getting there. The first thing that pops out is that we’ve identified the 4 true peaks that we were hoping to see here. But we also got some false peaks — like a momentary peak at the 0.5 second mark(you can see a single orange marker there). Or similarly a single green marker just before our first real, red, peak. Clearly we need to somehow reject very small outlier observations. Maybe we can get away with tossing all the segments that only lost a very short duration. But would that be good enough?
for start_loc,end_loc in zip(segment_starts, segment_ends):
    print(t[end_loc] - t[start_loc])0.03999999999999998
0.03999999999999915
0.43900000000000006
0.08000000000000007
0.359
0.7590000000000003
0.19900000000000162 * note: this corresponds to the gray segment
0.3990000000000009
Close, but no cigar. If we were to reject very short peaks, we’d get rid of 3 false positives, but you can see from our graph that our last peak was accidentally split off into 2 sub-segments in gray and mustard-color. Our code will be very brittle if we just rely on segment time lengths. Basically a single momentary dip below our threshold for high acceleration can always break our segment in 2.
So let’s take one last stab at improving this. Let’s pre-process our signal to make it robust against momentary lapses like that.
Smoothing the Curve
My undergrad was in Physics and Electrical Engineering, so I think I’m compelled to give a nod to the fact that this section is ultimately just the application of a low pass filter designed to reject the high frequency components of our signal.
But you don’t need to know the first thing about digital signal processing to understand what we’re doing here. We don’t like it that our signal has these small noisy jerks up and down that can easily generate false peaks and false dips below our threshold value. If we smoothed out our signal to only let consistently high measurements pass our threshold, we’d be in a better place. This can be as simple as averaging every N consecutive measurements . We could try to throw in other low-pass filters instead and see if the result improves, with the general understanding that low pass filters try different weighting for averaging neighboring measurements. We’re gonna keep this super simple: replace the value of every measurement by the average of N measurements around it.
Averaging the signal
Looking at the prints I showed above, it looks like a real segment typically lasts about 0.4 second, which feels about right from my personal experience squatting. A single sample comes in every 0.04 seconds, so that means that looking at roughly 10 neighboring samples is the right ballpark for how many measurements we want to average together. If you’re wondering how I know that a single sample comes in every 0.04 seconds, it’s pretty simple:
import numpy as np
print(np.diff(t))
[0.04  0.041 0.039 0.04  0.04  0.04  0.04  0.039 0.041 0.039 0.04  0.04....]
# cool: our data is coming in at almost exactly even time spacing, every 0.04 seconds. If it was less consistent, we'd be interpolating to a fixed time window. But we can get away with just pretending the time spacing is even
So how do we average every 10 samples together? We could write a for loop that does exactly that. But it’s more computationally efficient and completely equivalent to convolve the signal with a filter with 10 samples whose value is 1/10. Here’s the code:
If you’re not familiar with the concept of convolution and this looks a bit like mumbo jumbo, that’s ok. Googling “how do I calculate a rolling average in python” would land you on the same code that I wrote pretty much. Still I’d say if you’re going to work with 1-dimensional signals, understanding how convolutions work and what’s a filter is a good idea for further reading. So what does the output look like? Let’s rerun the code after filtering our acceleration data frame
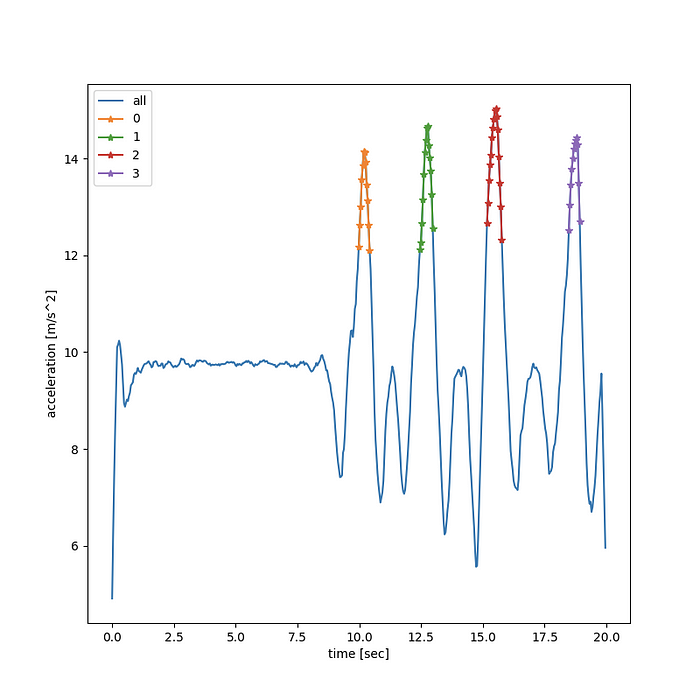
Great Stuff! we caught all 4 squats for this session, this time with 0 false positives.
Version 0.1 Complete. What’s next?
Alright, so we hacked together a super simple first version. We won’t do any more development in this post. But before we part, I want to highlight what’s the next steps to make this into a robust app:
You can’t improve if you don’t measure yourself
So far we’ve been hacking like mad to make the results work for a specific tiny set of examples that guide us. By now I have a bunch of ideas on how to improve results further, make the code robust to arbitrary phone orientation, etc.
But the first thing I’ll do in the development cycle won’t be code changes to our squat counter. Now that we have a first working version, the thing to do is calculate how well we’re doing, and make sure that subsequent code change we make move this number in the right direction.
Luckily, our problem is very well defined so we can measure ourselves! For every recording I’ve made, I’ve diligently wrote the number of squats. This label is available when we grab our sessions data from Moonsense. So in our next chapter we’ll add a piece of code that captures what’s our average error, and then start to make changes in order to lower our error metric.
We’ll also try to see if we can tackle the idea of quantifying squat quality level — perhaps defining quality by “consistency”. Or maybe extracting a few descriptive statistics like the peak accelerations, and seeing how these number match up against expert evaluations of the squat quality based on a video of the same session. We could even label each session with an expert evaluation for squat quality, and train a machine learning model that predicts the expert evaluation based on the numerical features we’ve extracted. This would make our app into a potentially fun & useful product.
Close the loop and make this into a live app
Moonsense have a neat little feature called “data consumer”, where you can define a function to process new data as soon as it becomes available. This allows near real time behavior like sending the user a push notification as soon as they’ve done their squats. Once we have a decent squat quality estimator we could give immediate user feedback for how well they did their squats.
You can find the full code example in this repo

